One of the most widely used configurations is the original commercial model FM-1 unit marketed in the 1960s by Princeton Applied Research (PAR) Corporation. This unit utilized Foner's basic principles. Our unit uses these same basic principles with modifications related to the advancement of microelectronics, most important the use of a lock-in amplifier to obtain the signal. (Ref. 3)
Figure 1 shows a typical Vibrating Sample Magnetometer (VSM) setup. The material under study in the VSM is inserted in the sample holder so that it rests centered in a pair of pickup coils between the poles of an electro magnet. The sample holder is mounted using a sample rod in a transducer assembly which passes through the center of a driving coil. The transducer is driven by a power amplifier which itself is driven by an oscillator. The magnetic sample under study is constraint to vibrate only along the vertical axis. As it does so, it induces a signal in the sample pickup coils as described above. The magnitude of this signal is dependent on the magnetic properties of the sample itself.
Attached to the sample holder rod is a permanent magnet. A pair of stationary coils pick up the induced ac signal, which is proportional to the amplitude and frequency of the vibration and is used as a control signal for modulation of the transducer. The output of the sample coil is fed to the differential input of a lock-in amplifier. The reference input of the lock-in comes from the sine wave oscillator used to drive the sample holder. The output of the lock-in goes to the data acquisition computer as well as the magnitude of the applied magnetic field coming from a gaussmeter. The signal from the lock-in amplifier is directly proportional to the magnetic moment of the sample. The computer is now able to graph the magnetic moment of the sample against the applied magnetic field. (Ref. 4)
![]()
The permeability mu can be defined in terms of a relative permeability mu_r and the permeability of free space mu_o as:
![]()
The relative permeability can be defined in terms of the susceptibility Xi as:
![]()
The susceptibility is defined as:
![]()
where M is the magnetization. This leads us to the following equation which is true under all circumstances:
![]()
When a sample is placed in an external magnetic field H it will respond with a magnetic induction B_(sample) of:
![]()
where M is the magnetization in the sample. We can relate the magnetization to the magnetic moment m and the volume v to get:
![]()
At any point in free space outside the sample a magnetic induction B_(by sample) proportional to the magnetic moment m of the sample is present:
![]()
where g is a proportional constant depending on the position of the point in space. The total magnetic induction at a point in space is:
![]()
where B_(ext. field) is the magnetic induction of free space due to the external magnetic field H. Note that when the external field B_(ext. field) is varied the sample pick up coils do not pick up the change due to the fact that the coil pairs are wound in opposite directions as explained in a different part of the paper. When the sample is moved near a pickup coil a voltage is induced in the coil:
![]()
Note that only the components of the fields normal to the area of the coil is included in this and all subsequent expressions. Since the external magnetic field H and consequently the magnetic induction B_(ext. field) due to the field is constant, we can write:
![]()
Note that g is not constant since it depends on the position of the sample and consequently is a function of time. If the sample is moved in sinusodial motion we can write:
![]()
where h is a proportionality constant. Absorbing the minus sign, N, O, and h in a constant k and taking the derivative we get:
![]()
As we can see a voltage V proportional to the magnetic moment m is induced in the coil.
A VMS (see figure 1 for a typical setup) uses an electromechanical driver (voice coil) to move a vertical drive rod with a small amplitude, A, and frequency, omega. Mounted on the drive rod is a sample, S, and a constant magnitude reference magnetic moment, R, which may be a small permanent magnet or small coil with a constant dc excitation current. Pick-up coils near R will have an induced voltage
![]()
where k_r is a constant depending on coil geometry, and m_R is the constant magnetic moment of reference R. V_R is in the millivolt range and easily measured by a rms voltmeter. Similarly, the sample pick-up coils will see a voltage
![]()
An rms-to-dc conversion is performed on both V_R and V_S by the rms voltmeter and lock-in amplifier, respectively. The ratio of these two dc voltages is then taken by a digital multimeter (DMM) which has ratio capabilities. Taking the root-mean-square average of the previous two equations it is seen that the dependence on frequency, omega, and drive amplitude, A, cancel and the DMM output is
![]()
where K is the calibration constant which has absorbed k_R, k_S, m_R, as well as any amplifications of the reference signal and the sample signal by the lock-in amplifier. Since the magnetic moment m is related to the magnetization M and the volume v of the sample we can write:
![]()
We can directly read off the magnetization of the sample M_S by writing:
![]()
Fig. 1 shows the system configuration. (Ref. 5)
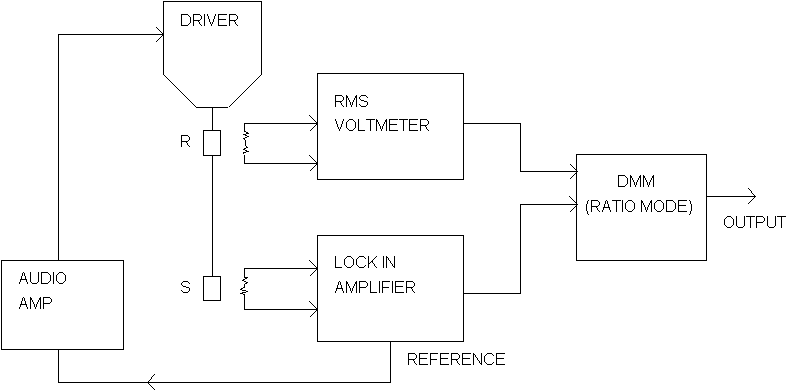
FIG. 1. Block Diagram of VMS Electronics.
Two signals are provided to the lock-in (see Fig. 2). An ac reference
is used to tell the lock-in the exact frequency of the signal of interest.
The lock-in's Phase-Lock-Loop (PLL) circuits will track this input signal
frequency without any adjustment by the user. The PLL output may be phaseshifted
to provide an output of ![]() .
.
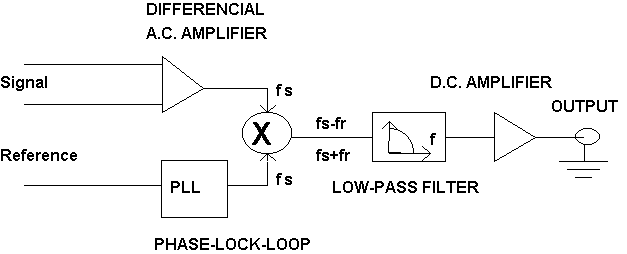
FIG. 2. Lock-in Amplifier
The signal from the sample is amplified by a high gain ac coupled differential amplifier. The output of this amplifier is multiplied by the PLL output in the Phase-Sensitive detector (PSD). This multiplication shifts each frequency component of the input signal, omega_s, by the reference frequency, omega_r, so that the output of the PSD is given by:
![]()
![]()
The sum frequency component is attenuated by the low pass filter, and only those difference frequency components within the low pass filter's narrow bandwidth will pass through to the dc amplifier. Since the low pass filter typically has time constants up to 100 seconds, the lock-in can reject noise which is more than .0025Hz away from the reference frequency input.
For signals which are in phase with the reference, the phase control is usually adjusted for zero phase difference between the signal and the reference. This can be done by maximizing the output signal. A more sensitive technique is to adjust the phase to null the signal. This places the reference oscillator at 90 degrees with respect to the signal. The phase control can now be shifted by 90 degrees to maximize the signal. (Ref. 6)
At constant temperature and for relatively low values of magnetic field H, the magnetic susceptibility Xi of diamagnets and paramagnets are constant. Under these conditions the materials are called 'linear', that is M is proportional to H. Therefore we can write:
![]()
![]()
Note that the linear approximation no longer holds at higher fields and paramagnets exhibit saturation of magnetization at very high fields. (Ref. 8)
One of the most characteristic properties of ferromagnetic materials is that once they are exposed to a magnetic field they retain their magnetization even when the field is removed. The retention of magnetization distinguishes ferromagnets from paramagnets which although they acquire a magnetic moment in an applied field H, cannot maintain the magnetization after the field is removed.
The most common way to represent the bulk magnetic properties of a ferromagnetic
material is by a plot of magnetic induction B for various field
strengths H, which produces the characteristic hysteresis loop.
Alternatively plots of magnetization M against H are used,
but these contain the same information since ![]() .
Hysteresis in iron was first observed by Warburg (Ref. 9). The term hysteresis,
meaning to lag behind, was introduced by Ewing1 (Ref. 10) who was first
to systematically investigate it. A typical hysteresis loop is shown in
figure 3.
.
Hysteresis in iron was first observed by Warburg (Ref. 9). The term hysteresis,
meaning to lag behind, was introduced by Ewing1 (Ref. 10) who was first
to systematically investigate it. A typical hysteresis loop is shown in
figure 3.
The suitability of ferromagnetic materials for different applications is determined principally from characteristics shown by their hysteresis loops. Materials for transformer applications need to have high permeability and low hysteresis losses because of the need for efficient conversion of electrical energy. Materials for electromagnets need to have low remanence and coercivity in order to ensure that the magnetization can easily be reduced to zero as needed. Permanent magnet materials need high remanence and coercivity in order to retain the magnetization as much as possible.
Application of a field H causes the magnetic induction to increase in the field direction. If H is increased indefinitely the magnetization eventually reaches a saturation value of M_o. This represents a condition where all the magnetic dipoles within the material are aligned in the direction of the magnetic field H. In bulk materials, the saturation magnetization is dependent only on the magnitude of the atomic magnetic moments m and the atoms per unit volume n as:
![]()
M_o is therefore dependent only on the materials present in a specimen, it is not structure sensitive.
When the field is reduced to zero after magnetizing a magnetic material the remaining magnetic induction B_R is called the remnant induction and the remaining magnetization M_R is called the remnant magnetization related by:
![]()
The magnetic induction can be reduced to zero by applying a reverse magnetic field H_o of strength (see figure 3). This field strength is known as the coercivity. It is strongly dependent on the condition of the sample, being affected by such factors as heat treatment or deformation.
The permeability mu is not a particularly useful parameter for characterization of ferromagnets, since by the nature of the hysteresis loop almost any value of mu can be obtained including mu=infinity at the remanence B=B_R, H=0 and at coercivity mu=0. The differential permeability mu'=dB/dH is a more useful quantity although this value varies also with applied field H. The maximum differential permeability mu'_(max), which usually occurs at the coercive point H=H_c, B=0, and the initial differential permeability mu'_(in) which is the slope of the initial magnetization curve at the origin, are much more useful since it is possible to relate them to other material properties such as the number and strength of pinning sites and applied stress.
All ferromagnets when heated to sufficient high temperatures become paramagnetic. The transition temperature from ferromagnetic to paramagnetic behavior is called the Curie temperature. At this temperature the permeability of the material drops suddenly and both coercivity and remanence become zero. (Ref. 11)
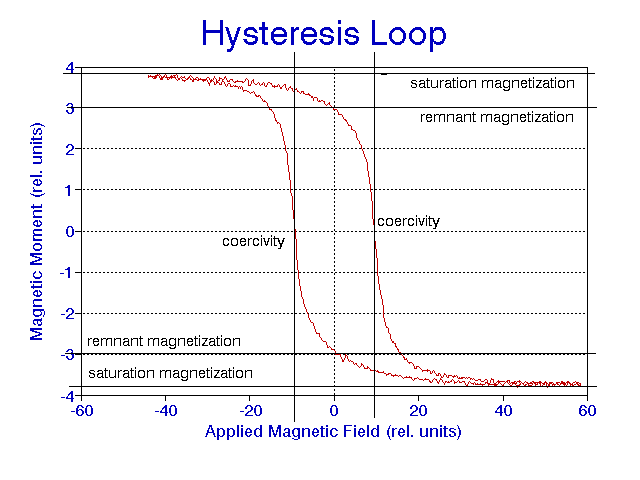
FIG. 3. Typical Hysteresis Loop
In summery the following parameters can be obtained from hysteresis loops to characterize a ferromagnetic sample (see figure 3). First of all the saturation magnetization M_o gives an upper limit to the magnetization that can be achieved. At temperatures well below the Curie point the technical saturation M_s can be used instead due to the fact that it is very close to M_o. The width of the loop across the H axis, which is twice the coercivity H_c, is also an independent parameter since this can be altered by heat treatment and hence is not dependent on M_s. The height of the curve along the B axis, that is the remanence B_r, is also an independent parameter since it is not wholly dependent on M_s and H_c. The orientation of the whole hysteresis curve, which can be expressed as mu'_(max), the slope of the curve at the coercive point, can change independently of the other parameters. The other important independent parameters are the hysteresis loss W_H and the initial permeability mu'_(in). Magnetic Properties of ferromagnetic materials are usually displayed in tabular form in terms of coercivity, remanence, hysteresis loss, initial permeability, maximum permeability and saturation magnetization or saturation magnetic induction. (Ref. 12)
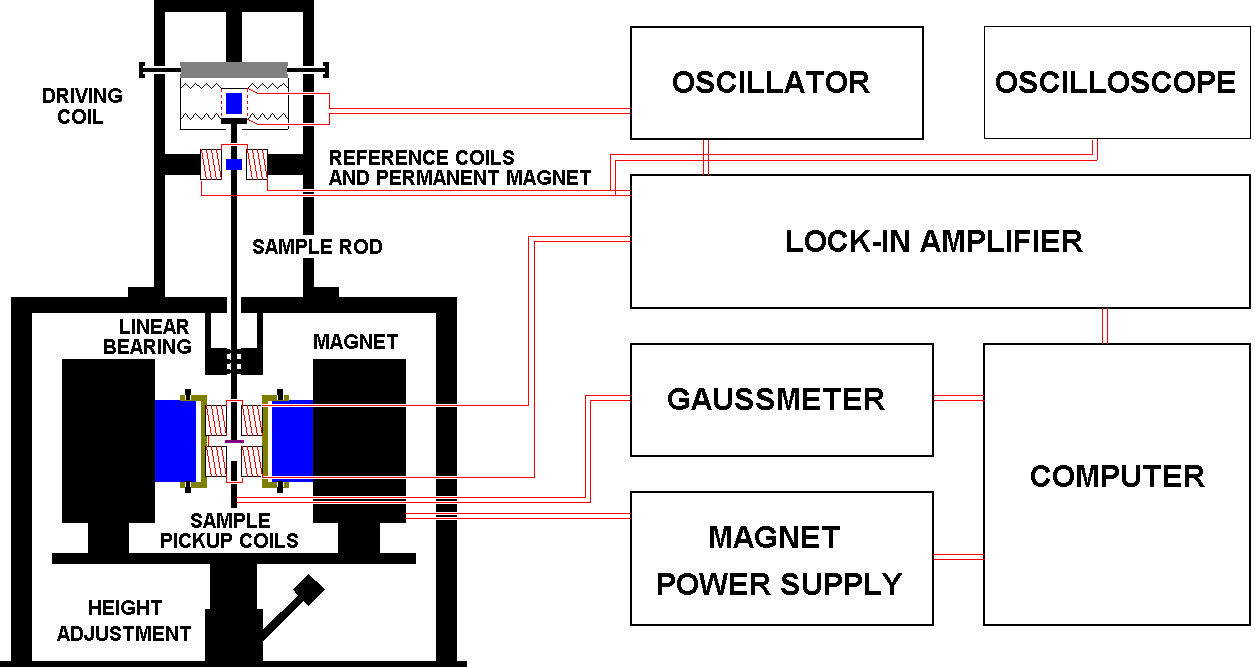
FIG. 4. System Overview
For a system overview refer to figure 4. An PASCO SCIENTIFIC MODEL PI-9587A Oscillator is used to drive the PASCO SCIENTIFIC MODEL SF-9324 driving coil, which is mounted on support rods connected to a table. The oscillator puts out a sine-wave, whose amplitude is adjustable from 0 to 13 volts. The frequency used was typically around 800Hz. Lower frequencies had the tendency to shake off the sample or loosen the sample holder assembly since higher amplitudes were needed for a good signal. The driving coil and the sample rod connected to it can be rotated by 360 degrees to allow angular studies of samples. The upper part of the sample rod consists of aluminum and the lower part is made out of fiberglass to minimize effects of paramagnetism. Attached to the top portion of the sample rod is a strong permanent rare earth magnet, which is placed between two stationary reference coils of around 1000 turns each with a combined resistance of 27 Ohm. The induced signal is usually on the order of 1mV. The end of the sample rod first goes through a linear bearing before terminating between the pole faces of a ALPHA SCIENTIFIC LABORATORIES MODEL 7500 WATER electro-magnet. The magnet is powered by an ELECTRONIC MEASUREMENTS MODEL BOS/S 72-6-1 power supply, which can supply enough current to reach a peak field of about 3000 Gauss. The round pole faces of the magnet are covered with a plastic cap which serves as a mounting platform for the sample pickup coils, whose vertical separation can be adjusted as well as there orientation towards the opposing pair of coils. Each coil consists of 872 turns of copper wire and each coil has a resistance of about 26 Ohms. The horizontal gap between the coils is around 1.5cm.
The trigger output of the oscillator, which supplies a square wave with the same frequency as the sine-wave, is connected to the lock-in amplifier as the reference frequency. The reference coils are connected to both a STANFORD RESEARCH SYSTEMS SR510 lock-in amplifiers ratio mode denominator input and an TEKTRONIX MODEL 422 oscilloscope. The oscilloscope is used to monitor the motion of the sample rod to ensure that it delivers a good sine-wave. It is essential to find a frequency which does not resonate with any pieces of the apparatus to ensure a good quality sine-wave of constant amplitude. The numerator input of the ratio mode of the lock in is connected to the sample pickup coils. The output of the lock-in is connected to the data acquisition computer. The computer is also connected to an APPLIED MAGNETICS LABORATORY MODEL GM1A gaussmeter whose probe is placed between the pole faces of the electro-magnet. The data acquisition computer consists of an IBM PS/2 system with a DACA interface card run under Uncel Scope 3.1. The software was set up to place the electro-magnets field on the x-axis and the output of the lock in amplifier on the y-axis. The computer is also connected to the magnet power supply to ramp the electro-magnet.
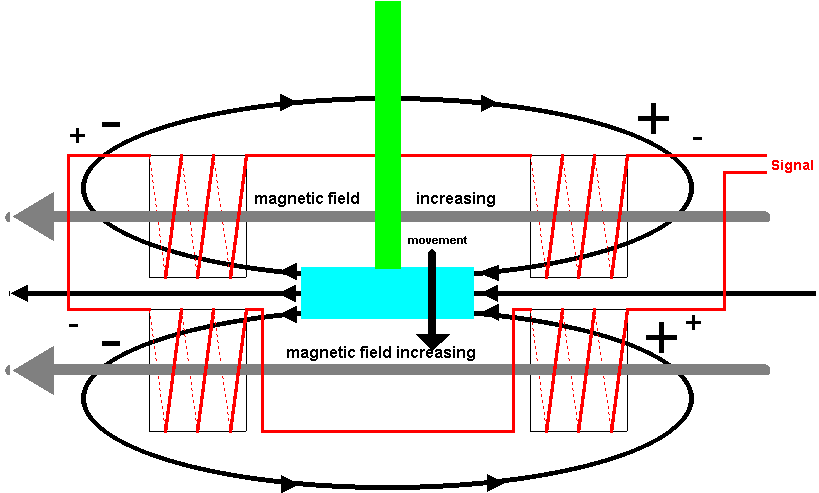
FIG. 5. Induced Voltages in Coils
The coils are wound by using a home built computerized coil winder (see figure 6). A linear guidance rod ensures even distribution of the wire on the coil. The program to control the two step motors is written on an IBM PS/2 under LABWINDOWS (RELEASE JAN. 1990) using a NATIONAL INSTRUMENTS LAB-PC interface card. The step motor controllers used are from a kit, modified for computer control. The only input information needed by the program is the diameter of the wire, the width of the coil, and the number of turns desired.
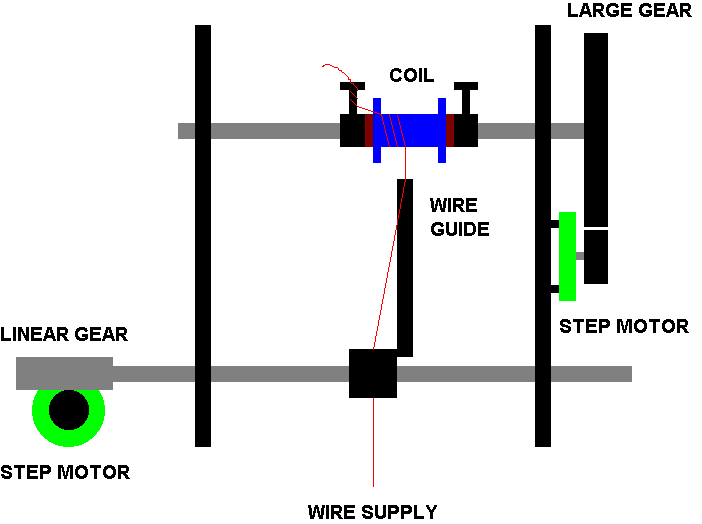
FIG. 6. Coil Winder
A 7000A Fe sample was used to find the best placement of the sample between the coils, which means a position at which a vibrating sample produces a good induction in the coils as well as a position which is insensitive to small errors in placement of the sample. The sample was first placed level with the top edge of the upper pair of coils. The electro-magnet, producing a constant field of around 2000 Gauss, was raised in steps of 0.5cm, which effectively lowered the sample between the coils. At each point the output at this constant field was measured.
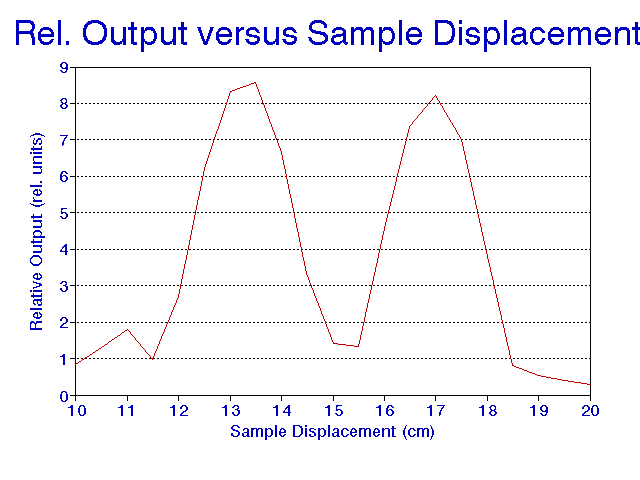
FIG. 7. Optimum Sample Placement
As we can see in figure 7 the optimum placement for greatest induction was close to the center of both the upper or lower pair of coils. The best plateau is located between the pair of coils which we expected to have a much better induction. Because the induction of the coils was so poor at that position we had to use the position of the maximum induction to obtain a useful signal for non bulk samples. Note that this does not mean that the other pair is useless. It still minimizes noise as described before, especially noise introduced by the changing field of the electro-magnet. I think the reason that the plateau between the coils produces such a poor induction in the coils is due to the large radius of the coils. Their centers are too far apart since we could not move them any closer together. Unfortunately time did not permit the winding of more narrow coils to check if this effect is really due to the relatively large diameter of the coils.
In theory it is very easy to calibrate the y-axis, namely the magnetization. First the apparatus is set to a convenient frequency that provides nice sinusodial vibrations of the sample. This can be checked using the oscilloscope. Next a sample of known saturation magnetization is inserted in the sample holder. By saturating the magnetization in the sample with the heighest attainable field from the electro-magnet the lock-in sensitivity can be adjusted so that the display deviates from zero as far as possible without overshooting its range. Now it is possible to read of the calibration constant in (A/m^2)/Volt. The calibration sample can now be exchanged for the sample to be measured. If the sensitivity setting on the lock-in has to be changed, the calibration constant has to be multiplied by an appropriate calibration factor to compensate for a different sensitivity setting on the lock-in. If the sample has a different volume as the calibration sample the calibration constant has to be corrected further by multiplying it by the ratio of the two volumes. In practice this turned out to be not as easy due to problems with our system described in a later section and the lack of an appropriate calibration sample.
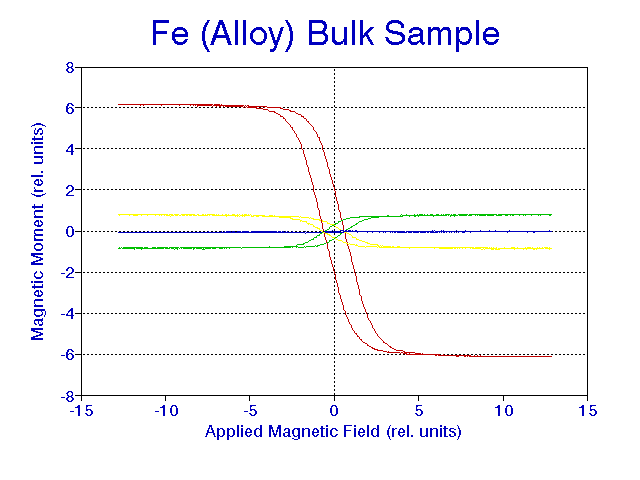
FIG. 8. Large hysteresis loop: 290 degree, other hysteresis loops around 340 degree show phase shift
In trying to detect a 7000A Fe sample another problem came into play. The sensitivity had to be increased by a factor of about 100 from the bulk sample to detect this sample (see figure 9). The lock-in was set to a sensitivity of 5uV with a time constant of 300ms. At this sensitivity it was found that a constant dc-offset was present in the signal coming from the coil driving the sample rod. It turned out that the tin can did not provide sufficient shielding against the fields coming from the coil. It also turned out that the constant offset changed in magnitude as a function of applied field at higher fields. No sufficient explanation was found for this phenomena. Worse, it was found that when performing angular studies this offset is a function of the angular rotation of the sample due to the fact that the vibrating coil rotates with the sample.
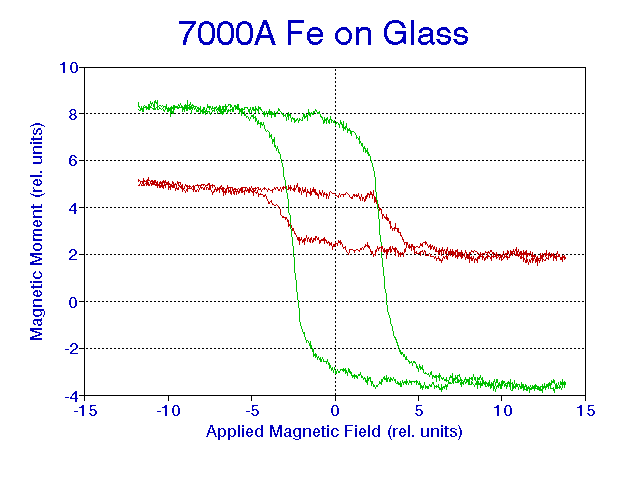
FIG. 9. Large hysteresis loop: 280 degree, small hysteresis loop: 150 degree
In trying to detect a 100A Fe sample on InGaAs another problem occurred. The sensitivity was increased to the full sensitivity of the lock-in, namely by a factor of 5000 from the bulk sample. The lock-in was set to a sensitivity of 100nV, a time constant of 10s, one sweep took about 12min, and the signal was averaged 10 times. Figure 10 might suggest that there is a hysteresis loop present around 0 field, but at higher fields unexplained hysteresis is detected as well.
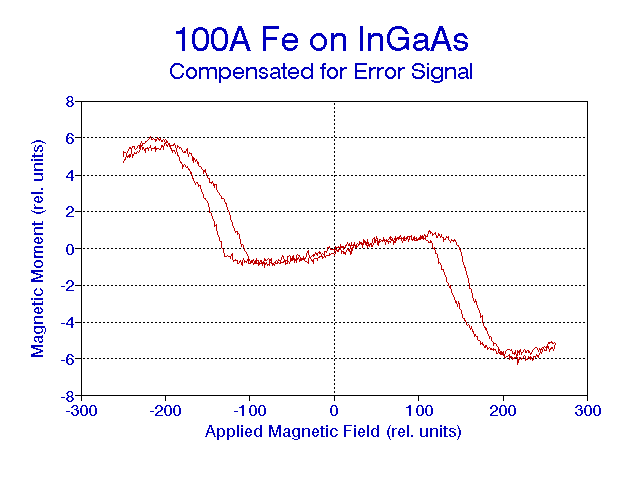
FIG. 10. Graph suggests hysteresis loop at center.
The linear bearing could be replaced by a folded circular constraint to maintain good sinusodial motion of the sample rod. The sample rod itself should be replaced by a rod known to be straight before installed and the whole assembly has to be manufactured to tighter tolerances. Another option would be to install the bearing or the folded constrainer close to the vibrating coil and then making sure that the rod is straight and well adjusted all the way down to the magnet.
To reduce the error due to the placement of the sample the plateau position between the coils must be improved. This can probably be done by winding more narrow coils and moving their centers closer together to raise the amount of induction at the plateau position.
To get rid of the noise from the driving coil better shielding is needed, made out of metal that constraints the field inside the container. In addition it would be helpful to mount the driving coil stationary and make the sample rod turnable to eliminate any angular dependence by the noise coming from the coil. This way any noise left over can be subtracted from the signal.
Another improvement not related to noise would be to connect a step motor to the sample rod to allow for automatic data collection when doing angular studies of samples.
2 Princeton Applied Research, Brochure: "Model 4500 VIBRATING SAMPLE MAGNETOMETER", 2
3 Kevin D. McKinstry, Carl E. Patton, Charles A. Edmondson, Paul J. McClure, Rev. Sci. Instrum. 62 (3), 779, (1991)
4 Princeton Applied Research, Brochure: "Model 4500 VIBRATING SAMPLE MAGNETOMETER", 3
5 J. A. Gerber, W. L. Burmester, D. J. Sellmyer, Rev. Sci. Instrum. 53 (5), 691, (1982)
6 Stanford Research Systems, Operating Manual: "MODEL SR510 LOCK-IN AMPLIFIER", 25
7 Magnetism and Magnetic Materials, David Jiles, Chapman and Hall, 1990, p. 33
8 Magnetism and Magnetic Materials, David Jiles, Chapman and Hall, 1990, p. 34
9 Warburg, E. (1981) Ann. Physik, 13, 141
10 Ewing, J. A. (1900) Magnetic Induction in Iron and other Metals, 3rd edn, The Electrician Publishing Co., London, 1900, and (1882) Proc. Roy. Soc., 220, 39
11 Magnetism and Magnetic Materials, David Jiles, Chapman and Hall, 1990, p. 69
12 Magnetism and Magnetic Materials, David Jiles, Chapman and Hall, 1990, p. 90
Back to my home page